RB Regression: Can Austin Ekeler and Jamaal Williams Overperform Again in 2023?
When it comes to fantasy football -- and daily fantasy football or best-ball fantasy football -- touchdowns matter.
A lot.
Outlier games (which are crucial for every type of fantasy football) are tied quite heavily to touchdown variance, and that means we need to target touchdown scorers.
But we also don't want to chase touchdown scorers -- because that can be a bad long-term strategy.
Though that sounds like a bold claim, touchdown regression is a very real thing, and history indicates that we should take advantage.
I'll be looking at running backs who overperformed (and underperformed) in the touchdown department in 2022 -- and lay out why it makes sense to put stock into what we see.
Defining Touchdown Regression
The idea of regression can be both complex and oversimplified, and I'm going to err on the side of oversimplifying it initially.
Simply put, regression just suggests that players will return to a baseline level of performance over a larger sample.
When a player scores a ton of touchdowns, he's probably good, yes, but he's also likely to score fewer touchdowns moving forward and trend back toward his long-term baseline.
Likewise, when a player -- say -- racks up elite yardage but scores just a handful of times, he's likely to score at a higher rate moving forward.
To make it a little more complex now -- and don't worry if math isn't your thing; we're just talking touchdowns here -- we can leverage a regression model to compare various stats to touchdown totals, determine a mathematical relationship between the two stats, and then use that to find expected touchdown output.
To varying degrees, passing stats such as passing yards, passing air yards, and numberFire's Passing Net Expected Points (NEP) tell us a lot about touchdown totals. (NEP is just an Expected Points Added [EPA] model by another name.)
History tells us that when yardage goes up touchdown totals go up. And we can put a tangible number on exactly how much yardage and NEP tell us about touchdowns. That's our key here.
Testing the Process
I'm going to go over how predictive this process is for running backs, but if you're not interested in that, you can just skip down to the results and dig into this upcoming season's regression candidates.
Based on the best math possible, I'm using three stats to predict expected touchdowns (xTD).
- Rushing Attempts
- Rushing Yards
- Successful Rushes
Successful rushes are earned when a carry increase's a team's expected scoring based on numberFire's Net Expected Points (NEP) model, which -- again -- is another name for an Expected Points Added (EPA) model.
Now, if we look at running backs since 2012 (through 2021) with at least 100 carries in consecutive seasons to give us a year-over-year sample to compare, we see that regression is pretty dang real.
Among 66 overperforming running backs with a TD% (touchdowns per carry) rate of 1.0% greater than their xTD%, only 8 (12.1%) increased their TD% the following year. Instead, 58 of them (87.9%) decreased their touchdown rate the following season (by an average of -1.7%).
Of the 63 backs who underperformed, 77.8% increased their touchdown rate in the following qualified season.
For running backs, the stats that point to expected receiving touchdowns are:
- Receiving Yards
- Reception Net Expected Points (NEP)
Those regression trends also check out, but let's dig into the actual regression candidates for 2023.
Running Back Regression Candidates for 2023
Here's a snapshot of the 2022 running back class, their touchdown numbers, their expected touchdown numbers, and the difference between their touchdown total and their expected touchdown total.
The table includes receiving touchdowns and is sorted by total expected touchdowns from 2022's performance.
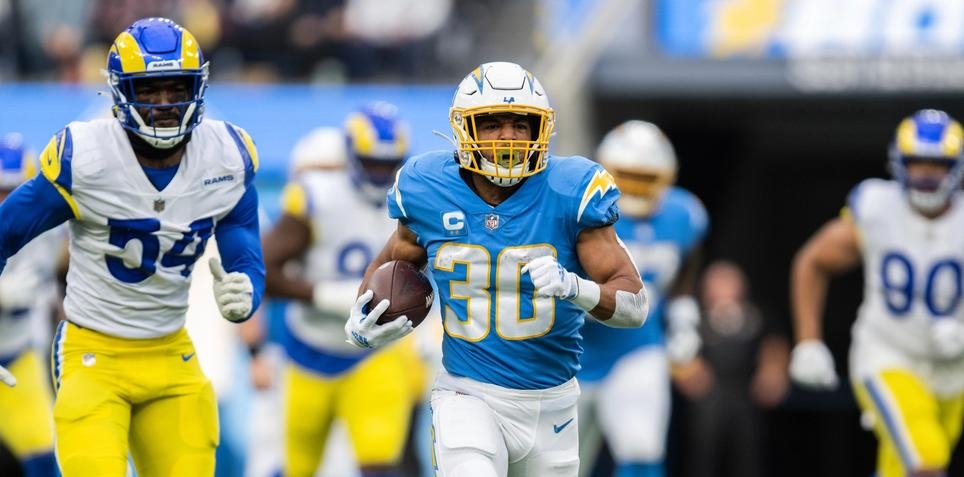
Austin Ekeler, Los Angeles Chargers
When I broke down quarterback touchdown regression, Justin Herbert was flagged as the poster boy. Part of the reason for that, clearly, is that Los Angeles Chargers running back Austin Ekeler massively overperformed in the touchdown column.
Ekeler's 18 total touchdowns led all running backs and was 7.8 more than expected based on his underlying variables.
It's worth pointing out that Ekeler overperformed in 2021 by 9.5 touchdowns (20 scores despite 10.5 xTDs).
His role allows him to score at an elevated rate, but for him to maintain his scoring rate for a third straight year would mean he's a true mathematical outlier like we've rarely ever seen.
He's being drafted as the RB2 in FanDuel's best-ball fantasy football format.
Alvin Kamara, New Orleans Saints
Jamaal Williams, New Orleans Saints
I'm going to lump two (now) New Orleans Saints together in Alvin Kamara (RB22 by average draft position [ADP]) and Jamaal Williams (RB32), who joined the team after a 17-touchdown season with the Detroit Lions in 2022.
Kamara had the largest raw negative touchdown differential (-5.3) of any back with 100-plus carries a year ago, and Williams (+8.2) had the largest positive gap from his xTD total.
Throw in a potential suspension for Kamara (after he pled no contest to a misdemeanor charge of assault) and an expected big-time goal-line usage for Williams, and these numbers might stay wonky.
Even if the math -- with no contextual changes when viewing past seasons -- shows clear regression trends, we always need to be aware of changes this obvious.
Travis Etienne, Jacksonville Jaguars
Travis Etienne (RB13) and the Jacksonville Jaguars have some high hopes in 2023. Their -155 odds to win the AFC South are the third-strongest odds of any team to win a division this season.
A big help there will be touchdown regression for Etienne, who scored only five times (with zero receiving scores) in 2022.
This is in spite of a 51.6% red-zone rushing market share and a 29.7% overall red-zone opportunity share (carries plus targets on all team red-zone plays) in his active games.
Tony Pollard, Dallas Cowboys
Although Tony Pollard (RB7) overperformed by 3.4 touchdowns (12 total on an xTD tally of 8.6), Ezekiel Elliott scored 12 times of his own (4.6 more than expected) and vacates a 54.5% red-zone rushing share and 30.0% red-zone opportunity share.
Pollard's rates were 32.1% and 21.5%, respectively.
So, while the math says that Pollard's touchdown rate should decrease, his opportunity shift should negate that a bit.
Brian Robinson, Washington Commanders
It's hard to view Brian Robinson's 2022 season as a negative in any sense given what he went through to see the field for the first time in the NFL.
With that said, his 3 touchdowns were less than half of his expected touchdowns (6.6), giving him the fourth-largest negative differential (-3.6) of any back, trailing Kamara (-5.3), Etienne (-4.1), and Tyler Allgeier (-4.1, who I didn't feature here due to the Atlanta Falcons' addition of Bijan Robinson).
Robinson is the RB33 in best-ball drafts.
Rhamondre Stevenson, New England Patriots
The fantasy community has high hopes for Rhamondre Stevenson (RB8) this season after a high-volume campaign in 2022.
Stevenson averaged 85.9 scrimmage yards per game (a 17-game pace of 1,460.3) yet scored only 6 times despite an xTD mark of 9.0.
That 9.0 xTD total ranked him 12th among qualified RBs.
The above author is a FanDuel employee and is not eligible to compete in public daily fantasy contests or place sports betting wagers on FanDuel. The advice provided by the author does not necessarily represent the views of FanDuel. Taking the author's advice will not guarantee a successful outcome. You should use your own judgment when participating in daily fantasy contests or placing sports wagers.